Проверка эссе IELTS (Writing Task 1)

Так выглядит эссе студента, проверенное преподавателем exam-english
TASK (source: IELTS Trainer, test 2)
Corrections:
The statistics from the table tells (not correct)
According to the table, (correct)
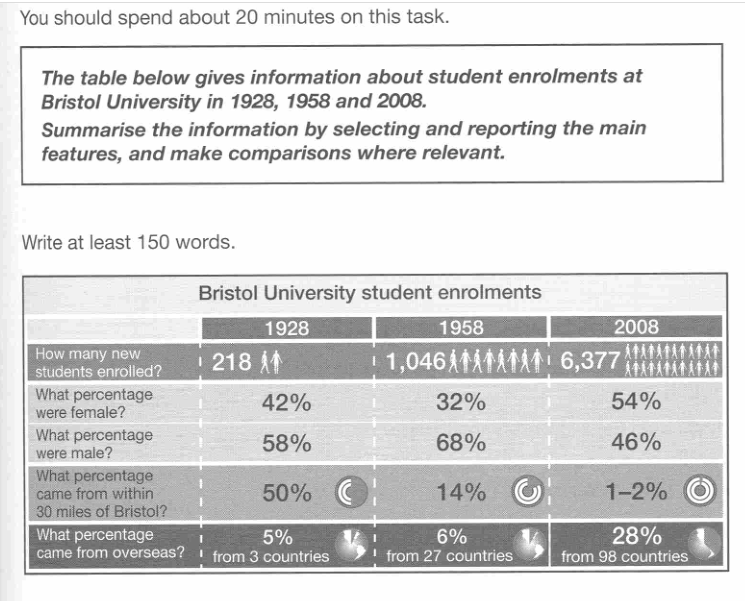
In the table we can see (The table shows) the numbers of new students of Bristol University, The table also shows the percentages of males and females and the percentage (proportions) of students who came from within 30 miles of Bristol and from overseas, in 1928, 1958 and 2008.
The statistics from the table tells (According to the table/ It is noticeable that) the number of new students in 1928 was almost five times less than became after thirty years (rose by almost 5 times between 1928 and 1958). In 2008, it again grew in more than six times [6377 students to that year] (In the following 50 years, it increased further, reaching 6,377 at the end of the period). The percentage of males and females was almost equal in 1928 and 2008, however male students had more than double superiority in percent quantity in another year noticed in the table (The percentage of female enrolments had dropped by 10% by 1958 and then went up to 54%, whereas the figure for males saw the opposite trend, falling to just under 50%). Another remarkable fact is that a half of all undergraduates came from within thirty miles of Bristol in 1928, but this amount (percentage/ figure) decreased to fourteen percent in thirty years. Likewise, the growth had not happened and volume of students enrolled the Bristol University from its nearby neighborhood fell to negligible percentage in another fifty years [one-two percent in 2008] (… and then to a negligible 1-2% over the following 50 years). However, the university has become (became) popular with overseas students since 1928 [more than a quarter percentage in 2008] (whose proportion increased from 5% in 1928 to just over a quarter in 2008)
Task Achievement:
The requirements of the task are generally addressed. However, the answer lacks a clear overview of the main trends (e.g., overall increase in student numbers, rising trend in female enrollments, increase in the proportion of overseas students). Try summarizing these features in one or two sentences. Put the overview just after your introduction or at the end of the response.
Some sentences are factually incorrect. For instance, you wrote ‘The percentage of males and females was almost equal in 1928 and 2008, although the figures for females are 42% (1928) and 54% (2008), while those for males are 58% (1928) and 46% (2008). The differences in both years are quite tangible (16% and 12%), so you cannot refer to them as ‘almost equal'.
You may write about the year 1958, when the difference between male and female enrolments was the greatest, comparing it with 1928 and 2008 figures. Or compare the general trends in female and male enrolments the way I’ve suggested (The percentage of female enrolments had dropped by 10% by 1958 and then went up to 54%, whereas the figure for males saw the opposite trend, falling to just under 50%)
Coherence & Cohesion:
There are some good linking phrases, such as ‘another remarkable fact' to introduce another piece of information, ‘or ‘however' to express contrast.
Use paragraphing to organize your text!
You’ve referred to 50% nicely (a half of all the graduates). Vary your language even further (e.g., 42% - ‘just over a fourth', 28% - ‘just under a third'). Quote specific numbers in brackets (), not in square brackets [ ].
Lexical Resource
You’ve used some good language about to talk about changes, such as 'decreased to 14%'.
You may use adverbs to show how something rose/ fell, e.g. increased markedly.
Study verbs for referring to specific data, e.g. ‘overseas students represented/ accounted for 28% of the total'.
Grammatical Range and Accuracy
Tenses are used correctly throughout, except for the last sentence, where present perfect should be changed for past simple. You may try using past perfect here (see my example in the text).
Study specific structures for comparing information (for example, instead of ‘male students had more than double superiority in percent quantity', use ‘in 1958 the percentage of males was double the proportion of females'. If the information was given in numbers, not in percentages, we would use ‘twice as many… as'.
Possible band: 5.5
Напишите нам, чтобы получить такую же подробную обратную связь по своим письменным работам.
— Напишите нам, и мы вышлем Вам темы для эссе и реквизиты для оплаты.
— Произведите оплату: 1600 руб (за оба эссе)
— Пришлите эссе нам на почту info@exam-english.ru
— Получите результат в письменном виде течение двух рабочих дней.