Bar charts IELTS Writing task 1

Как описывать столбчатый график в IELTS academic writing task 1
В этой статье мы проанализируем, как описать столбчатый график на примере задания из сборника Cambridge IELTS13, Test 2.
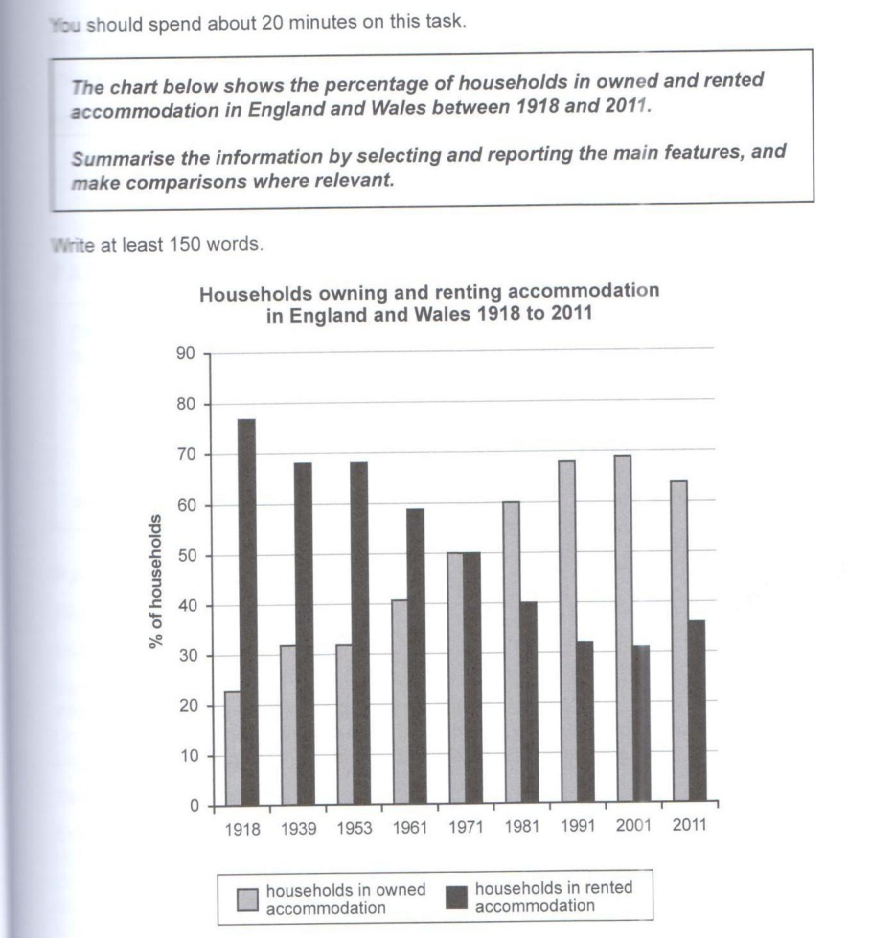
Bar chart: Households Owning and Renting Accommodation in England and Wales 1918 to 2011
Мы не рекомендуем приступать к письму сразу же, лишь мельком взглянув на задание. Потратьте несколько минут на анализ графика и планирование своего ответа, иначе вы рискуете потерять время во время письма и допустить ошибки в организации текста.
Шаг 1: Изучаем график. Что он показывает? (Households Owning and Renting Accommodation in England and Wales 1918 to 2011)
Обратите внимание на оси и единицы измерения:
а) горизонтальная ось указывает на годы (1918-2011). Это значит, что в описании нам следует использовать past tenses — в основном, Past Simple, но для получения высокого балла по критерию Grammatical Range мы также используем Past Perfect.
б) вертикальная — % of the households. Это значит, что в описании мы будем использовать термины percentage/ proportion/ figure, а не number.
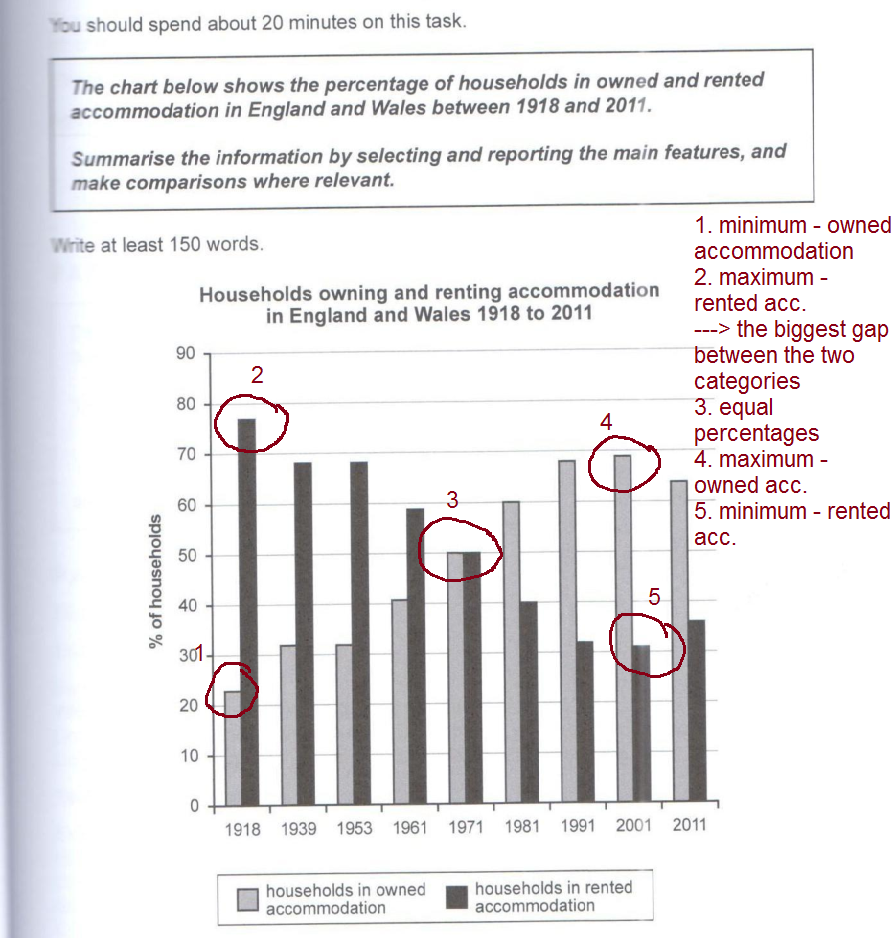
Шаг 2: Ищем основные черты графика: обратите внимание на любые значимые изменения, пики или спады.
Для наглядности мы отметим key features на графике.
Шаг 3: Организуем информацию. Возможный способ:
Body paragraph 1: households in owned & rented accommodation in 1918 — 1971
Body paragraph 2: households in owned & rented accommodation in 1918 — 1971
Он логичен и позволит нам использовать большое количество сравнительных структур. Конечно, это не единственно верный способ организации, и Вы можете выбрать свой.
Шаг 3: Определяем, какую информацию включить в overview.
Согласно словарю Cambridge, overview — a short description of something that provides general information about it, but not details. Overview в IELTS Writing Task 1- это четкое и ясное резюме основных трендов графика. О деталях (т.е. конкретных данных) писать не нужно!
Мы решили включить в overview следующие данные:
— нисходящий тренд для rented accommodation и восходящий тренд для owned accommodation;
- к концу периода owning accommodation стало более популярно, чем renting accommodation.
Шаг 4: Приступаем к письму.
Начинаем с introductory sentence — вводного предложения. Чтобы его написать, перефразируем первое предложение задания (the chart shows the percentages in owned and rented accommodation in England and Wales between 1918 and 2011). Как это можно сделать, смотрите в таблице.
| Задание | Перифраз |
| The chart below | The bar chart (below писать не нужно!) |
| shows | gives information about |
| the percentages in owned and rented accommodation | households that owned and rented accommodation |
| in England and Wales | in two countries |
| between 1918 and 2011 | from 1918 to 2011 |
Шаг 5: Пишем overview
Помните, что overview должно предоставлять общую картину и основные паттерны данных на диаграмме. Не вдавайтесь в подробности. Как правило, overview сигнализируют с помощью вводного слова Overall.
Overview можно расположить либо сразу после вводного предложения, либо в конце как заключение.
Что у нас получилось:
Overall, there was an upward trend in the percentage of the households that owned accommodation, whereas the figures for rented accommodation showed a falling trend. By the end of the period, owning accommodation had become more popular than renting it.
Шаг 6: Пишем основные параграфы
Советы:
- Организуйте параграфы в логической последовательности: Разделите свою информацию на несколько параграфов, каждый из которых будет описывать отдельный аспект или категорию данных.
- Укажите на ключевые значения или изменения: Опишите наиболее значимые значения или изменения в каждом столбце или группе столбцов. Упомяните максимальные или минимальные значения, а также любые интересные тенденции или различия.
- Используйте сравнительные выражения: Сравнивайте различные столбцы или группы столбцов, чтобы выделить различия или сходства. Используйте выражения, такие как «In contrast to», «Similarly», «Compared to», чтобы установить связи между данными.
- Используйте числовые данные: Подкрепите ваше описание числовыми данными из диаграммы. Укажите проценты, значения или любую другую доступную информацию, чтобы сделать ваше описание более точным.
Что у нас получилось:
At the beginning of the period, the gap between the households owning accommodation and those renting it was the largest, with the former accounting for around 23% of the households and the latter standing at 77%. By 1961, the proportion of the households in owned accommodation had increased by 17%, whereas the figure for those in rented accommodation had dropped by just under a fifth. In 1971, both figures stood at 50%.
Between 1971 and 2001, the percentage of the households in owned accommodation continued to rise until it reached the peak of 69% in 2001. After that, the figure slightly decreased to 65% in 2011. By contrast, the percentage of the households in rented accommodation fell to just over a third in 2001 before going up to 36% in 2001.
Шаг 7: Проверяем работу
Обязательно оставьте 2-3 минуты на проверку эссе.
Этот этап позволит Вам:
- Обнаружить грамматические ошибки, пунктуационные ошибки и опечатки, которые могут быть пропущены во время написания.
- Убедиться, что ваше описание имеет логическую структуру и последовательность параграфов и предложений.
- Варьировать использование языка и избегать повторений.
- Убедиться, что вы используете слова и фразы правильно и в соответствии с их значениями и контекстом.
Ниже приводим полный текст описание графика.
Bar chart Sample Answer
The bar chart gives information about households that owned and rented accommodation in two countries from 1918 to 2011.
At the beginning of the period, the gap between the households owning accommodation and those renting it was the largest, with the former accounting for around 23% of the households and the latter standing at 77%. By 1961, the proportion of the households in owned accommodation had increased by 17%, whereas the figure for those in rented accommodation had dropped by just under a fifth. In 1971, both figures stood at 50%.
Between 1971 and 2001, the percentage of the households in owned accommodation continued to rise until it reached the peak of 69% in 2001. After that, the figure slightly decreased to 65% in 2011. By contrast, the percentage of the households in rented accommodation fell to just over a third in 2001 before going up to 36% in 2001.
Overall, there was an upward trend in the percentage of the households that owned accommodation, whereas the figures for rented accommodation showed a falling trend. By the end of the period, owning accommodation had become more popular than renting it.
Bar Chart: useful expressions from the sample answer
В таблице представлены некоторые полезные слова и выражения для описания столбчатых графиков.
| to account for | составлять (часть) от общего количества |
| the former | первый (из двух вариантов) |
| the latter | последний (из двух вариантов) |
| to increase/ to rise/ to go up | увеличиваться |
| just under a fifth | чуть менее одной пятой |
| the figures stood at… | оба показателя составляли… |
| just over a third | чуть более трети |
| to descrease/ to drop/ to fall | уменьшаться/ падать |
| to reach a peak | достигать максимума |
| an upward trend | восходящий тренд |
| to show a falling trend | демонстрировать нисходящий тренд |
| proportion/ percentage | процент, доля |